Depressions, Fronts and Synoptic Charts
MeteorologyHow temperate depressions form and move, what warm, cold and occluded fronts are, what weather a ship meets as a Low passes, and how to read a synoptic chart and its geostrophic wind scale. It lets you forecast the next hours from your own barometer, wind and sky, and it is a standard MCA oral question.
Last reviewed 1 Nov 2026 · From a professional captain's years of study notes · Organised with AI and checked against current regulations · How we write
On this page (8)
How a temperate depression forms
In short: a temperate depression is born where cold and warm air meet and start to mix. It grows, brings fronts, then fills and dies.
Read first: this is the third topic of the Meteorology area. Read Pressure, Wind and the Coriolis Effect, then Humidity, Dew Point and Fog first. Next: Weather Instruments and Observations.
- In mid-latitudes, cold polar air and warm tropical air flow side by side in opposite directions. Their boundary is the polar front.
- Turbulence between the two opposing airflows of different temperature makes a wave on the boundary.
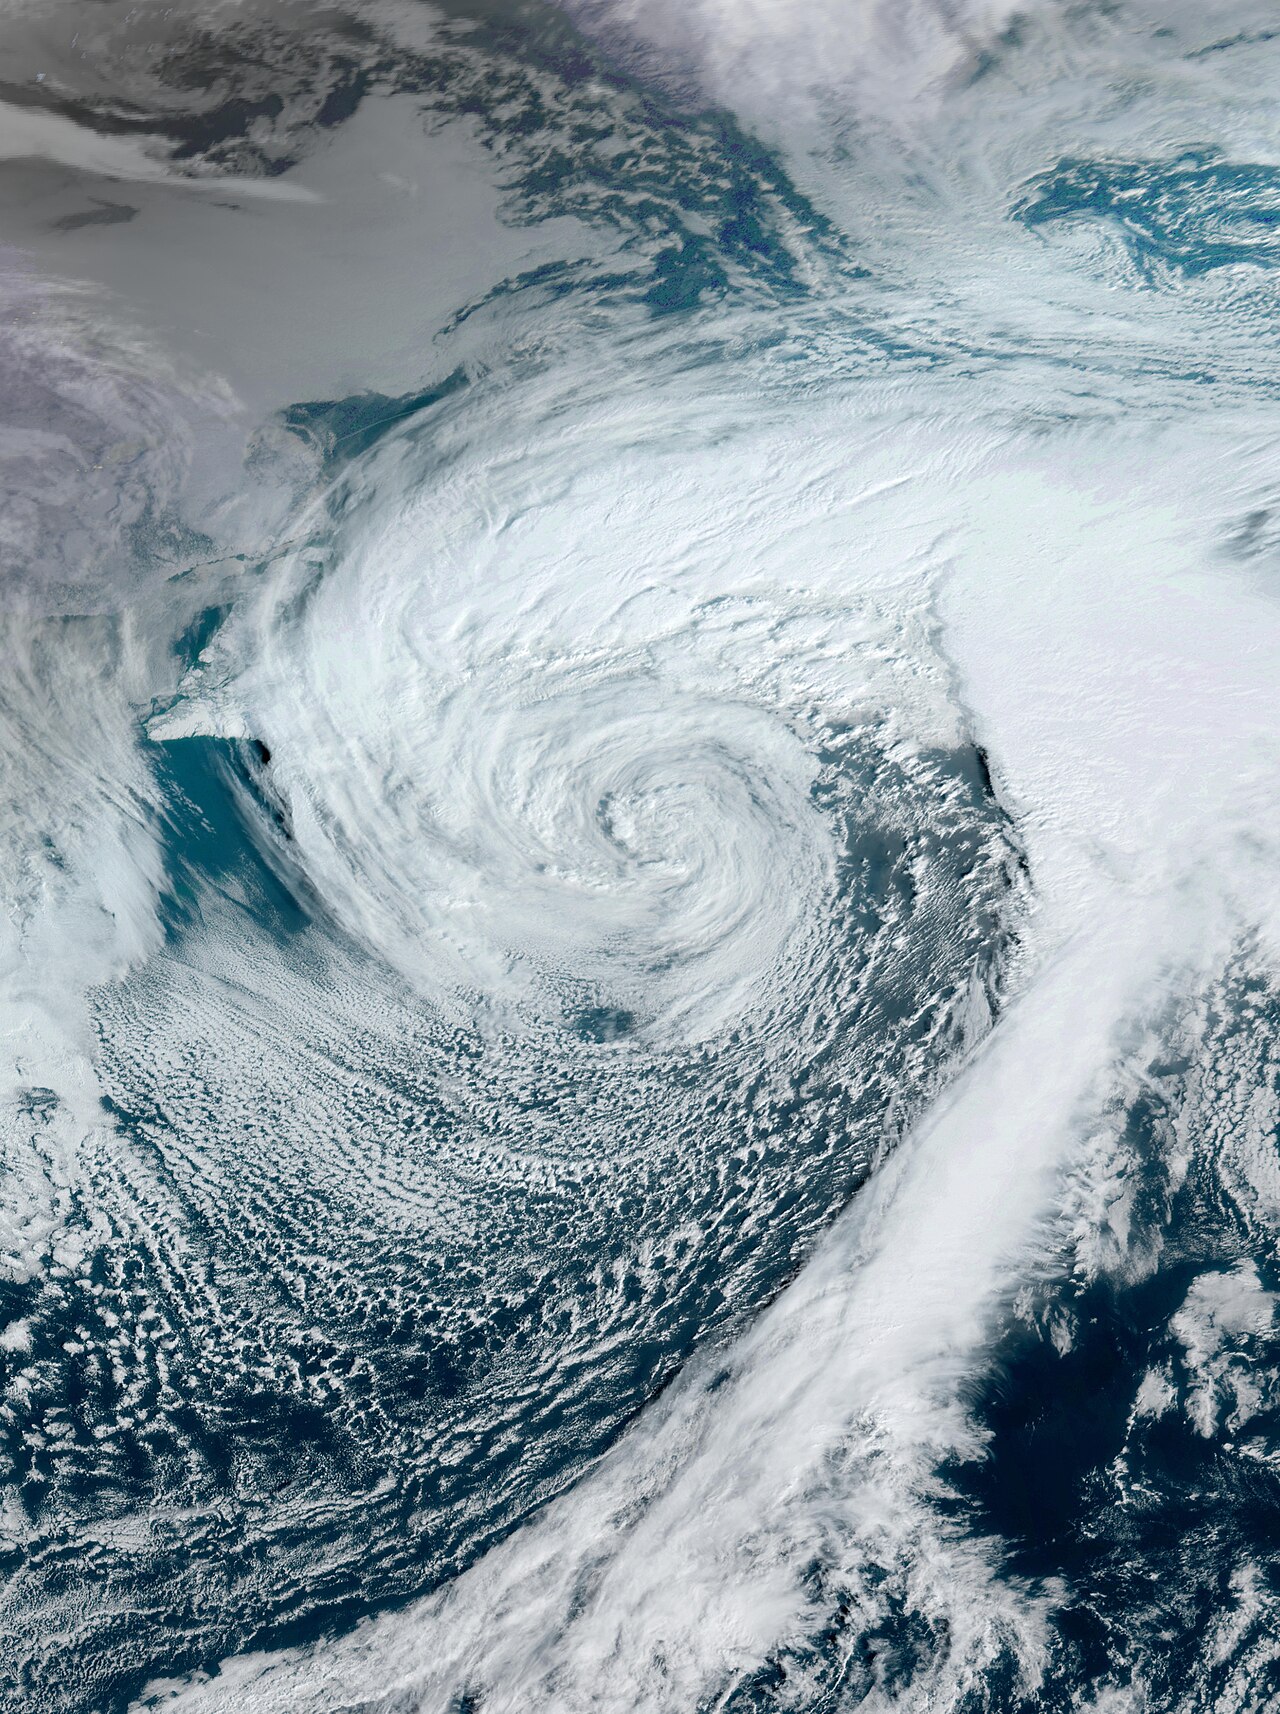
- Warm air pushes into the cold side and rises over it. Pressure falls at the tip of the wave and a Low forms. The air starts to turn round it (anticlockwise in the NH).
- The wedge of warm air between the two fronts is the warm sector. Its leading edge is the warm front, its back edge the cold front.
- The cold front moves faster than the warm front. It closes the warm sector and lifts the warm air off the surface: the front becomes occluded.
- After occlusion the Low usually stops deepening, slows down and fills (pressure at the centre rises).
Depression or hurricane?
- A temperate depression has fronts, drawn on synoptic charts.
- It is generally larger and moves faster than a hurricane.
- A hurricane (tropical revolving storm) forms over warm tropical sea and has no fronts. It is smaller, but its winds near the centre are usually much stronger. See the TRS topics.
- A deep temperate depression can still give hurricane force winds (Beaufort Force 12).
How depressions move
- In the NH mid-latitudes most depressions travel roughly west to east; most UK weather systems form over the Atlantic (Met Office).
- A young Low tends to move in the direction of the isobars in its warm sector.
- On the bridge: plot the Low’s position from successive charts. Its track and speed tell you which side of you the centre will pass, and when.
Warm, cold and occluded fronts
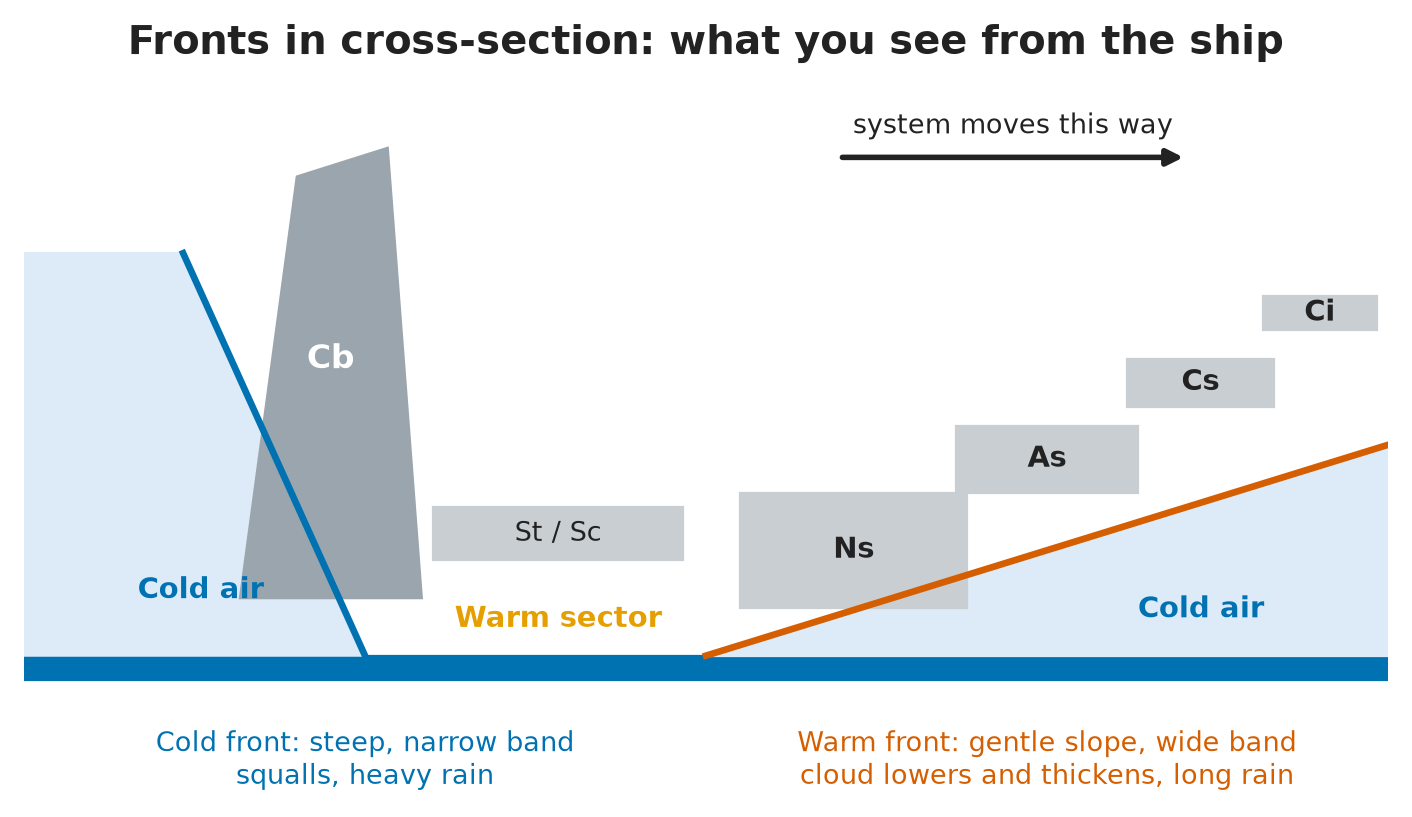
In short: a front is the boundary between two air masses of different temperature and moisture. Where the warm air is forced up, you get cloud and rain.
| Front | What happens | Chart symbol (Met Office) | Weather band |
|---|---|---|---|
| Warm front | Warm, lighter air rides up over colder air on a gentle slope | Red line with semicircles | Wide: cloud and rain long before the front arrives |
| Cold front | Cold, dense air pushes under the warm air and replaces it | Blue line with triangles | Narrow and violent: squalls, heavy rain, then clearance |
| Occluded front | The cold front catches up with the warm front; the warm air is lifted off the ground | Purple line with both symbols | Mix of the two; often a long band of rain |
- The symbols are drawn on the side towards which the front is moving.
- Cold fronts move faster than warm fronts. That is why occlusion happens.
- Waving front: a wave on a cold front can slow it down and give long spells of rain; models find it hard to forecast (Met Office).
- On the bridge: the warm front gives you hours of warning (high cloud, falling glass). The cold front gives little warning: watch for a dark line of cloud and get ready for a sudden wind shift.
Passage of a Low: what the ship sees
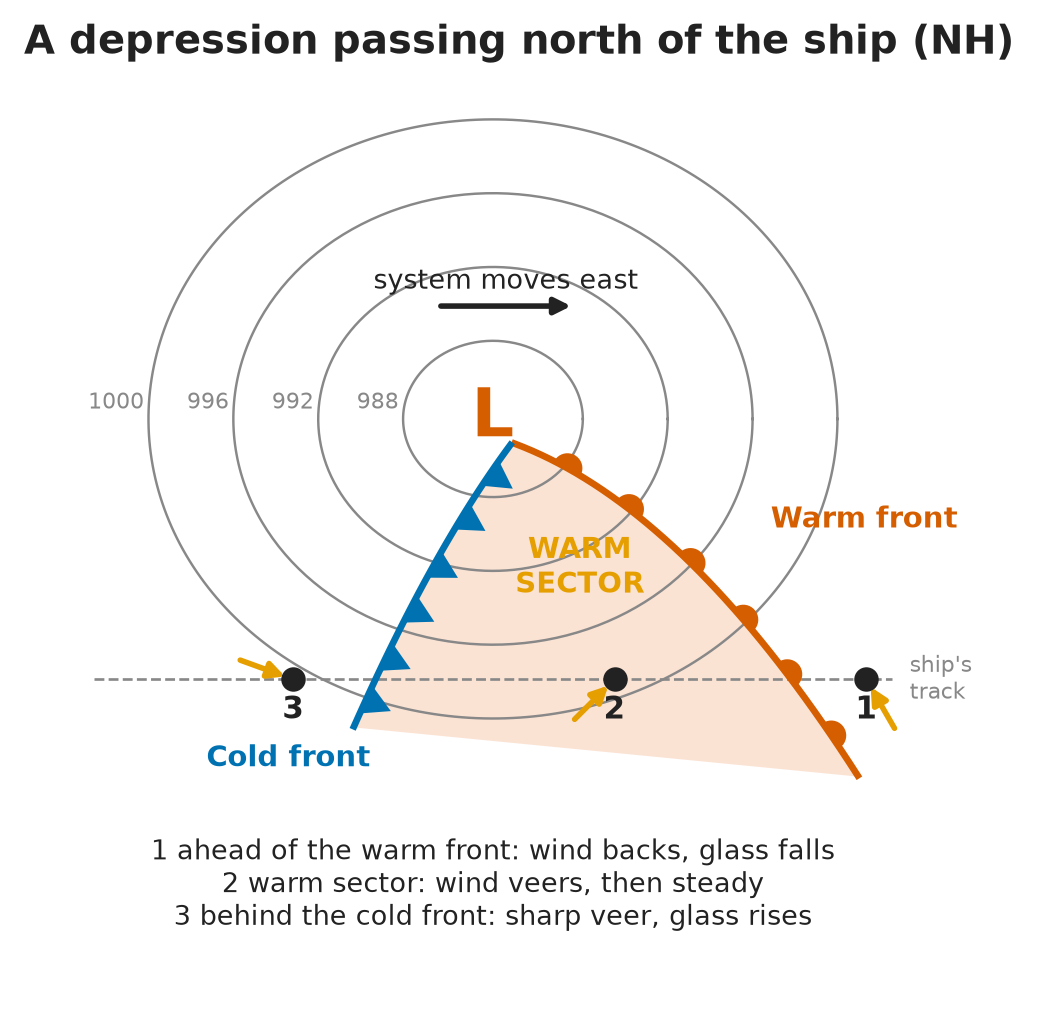
In short: as a frontal Low passes, the barometer, wind, cloud, rain, temperature and visibility change in a fixed order. Learn the order and you can tell where the fronts are from the bridge.
- The sequence below is for the Northern Hemisphere, with the centre passing to the north of the ship (the usual case, through the warm sector).
- In the Southern Hemisphere the pattern is mirrored: where the NH wind backs, the SH wind veers, and the other way round.
- If the centre passes to the south of you (NH), you stay on the cold side: no warm sector, and the wind backs steadily the whole time.
| Stage | Pressure | Wind | Cloud | Weather | Temperature | Visibility |
|---|---|---|---|---|---|---|
| 1. Ahead of the warm front | Falling | Backs, increases | Cirrus → cirrostratus → altostratus → nimbostratus, lower and thicker | Rain, intermittent at first, then moderate to heavy | Slow rise | Good, reduced in rain |
| 2. In the warm sector | Fall slows or stops | Veers at the front, then steady in direction | Low stratus / stratocumulus | Drizzle or light rain | Mild, steady | Poor, mist or fog |
| 3. Approaching the cold front | Steady or slow fall | May back slightly and freshen | Thickening low cloud, cumulonimbus behind | Rain becoming heavier | Steady | Poor |
| 4. At the cold front | Sudden rise | Veers sharply, squalls, gusts | Cumulonimbus | Heavy rain, hail, thunder | Sudden drop | Poor in rain |
| 5. Behind the cold front | Keeps rising | Steady or veering, gusty | Cloud lifts and breaks; cumulus | Showers | Cold | Very good outside showers |
Two details that often go wrong
- Warm sector cloud: you may see nimbostratus listed for the warm sector, with the wind veering and freshening. Standard meteorology places nimbostratus at the warm front; in the warm sector the wind veers and then holds steady, under low stratus or stratocumulus with drizzle and poor visibility. Give the standard answer in the oral.
- Rain ahead of the warm front: it starts as light or intermittent rain and becomes moderate to heavy as the front gets close. It eases or turns to drizzle once the front has passed.
On the bridge
- Log pressure, wind, cloud and visibility every watch. A falling glass with a backing wind and lowering cloud = a warm front is on its way.
- Warm sector: poor visibility — think about restricted-visibility measures and the fog topic.
- Before the cold front: secure the deck, warn the Master and the watch, expect a sudden veer and squalls. Adjust course and speed early.
- Use Buys Ballot’s law to place the centre: NH, back to the wind, the Low is on your left.
Reading a synoptic chart
In short: a synoptic (surface pressure) chart is a snapshot of pressure and fronts over a wide area at one time. Read it in a fixed order.
- 1. Heading: area, date and time in UTC, and whether it is an analysis (observed) or a forecast chart. Met Office surface pressure charts are updated about every 12 hours, around 0730 and 1930 UTC (Met Office).
- 2. Isobars: solid lines of equal pressure, at a fixed interval stated on the chart. Close together = strong wind; far apart = light wind.
- 3. Highs and Lows: marked H and L with their central pressure. Note where they are, how deep, and where they moved since the last chart.
- 4. Fronts: warm (red, semicircles), cold (blue, triangles), occluded (purple, both).
- 5. Other features:
- Trough — a line of low pressure out from a Low; often unsettled weather.
- Ridge — a tongue of high pressure out from a High; usually fair weather.
- Col — the slack area between two Highs and two Lows; light winds, sometimes fog.
- 6. Wind: NH — anticlockwise round a Low, clockwise round a High, roughly along the isobars and turned slightly in towards the Low. Strength from the geostrophic wind scale.
- 7. Your ship: mark your position and route. Work out which way the wind will shift and when the fronts will reach you.
The geostrophic wind scale
In short: the scale printed on the chart turns isobar spacing into a wind speed. It gives the wind above friction, so reduce it for the sea surface.
- The geostrophic wind blows parallel to the isobars, above the layer where surface friction acts (roughly the lowest 500–1000 m).
- How to use the scale:
- With dividers, measure the distance between two neighbouring isobars, at right angles to them, at your position.
- Lay the dividers on the geostrophic scale at your latitude (the same spacing gives a stronger wind at low latitudes).
- Read off the geostrophic wind speed in knots.
- The surface wind is weaker than the geostrophic wind, because of friction. Friction also turns it across the isobars, in towards the Low.
- Curved isobars change the real wind a little (stronger round a High, weaker round a tight Low). Treat the scale as a guide.
- On the bridge: compare the chart wind with your own anemometer and the sea state. If they disagree, trust your observations and check the next chart.
⚡ Flashcards
Test yourself, one card at a timeQ1How does a temperate depression form?
AnswerFrom turbulence where two opposing airflows of different temperature meet: cold polar air and warm tropical air. A wave grows on the boundary and a Low forms with a warm front and a cold front.
Q2How is a temperate depression different from a hurricane?
AnswerIt has fronts (you see them on the synoptic chart) and is generally larger and faster-moving than a hurricane.
Common trapA hurricane is a tropical revolving storm with no fronts.
Q3What are warm, cold and occluded fronts, and how are they drawn?
AnswerWarm: warm air rides up over cold air — red line, semicircles. Cold: cold air pushes under warm air — blue line, triangles. Occluded: the cold front catches the warm front — purple line, both symbols. The symbols point the way the front is moving.
Q4Passage of a Low (NH): what do you see ahead of the warm front?
AnswerPressure falling, wind backing, cloud lowering to altostratus, rain moderate to heavy, temperature slowly rising, visibility good but reduced in rain.
Q5Passage of a Low (NH): what do you see in the warm sector?
AnswerWind veers at the warm front, then holds its direction. Low stratus or stratocumulus, drizzle, poor visibility, mild and humid.
Common trapNimbostratus belongs to the warm front, not the warm sector.
Q6Passage of a Low (NH): what do you see as the cold front approaches?
AnswerCloud thickens and lowers again, towering cumulonimbus may show behind the low cloud; wind may back slightly and freshen; pressure steady or falling slowly.
Q7Passage of a Low (NH): what happens at the cold front?
AnswerWind veers sharply with squalls, pressure rises suddenly, temperature drops, heavy rain, hail or thunder. Then clearing skies, very good visibility and showers.
Common trapDo not relax at once: squalls and showers go on behind the front.
Q8Describe a synoptic weather chart.
AnswerDate and time (UTC), analysis or forecast, isobars, H and L with central pressure, fronts, and the geostrophic wind scale. Close isobars = strong wind. NH: wind anticlockwise round a Low, along the isobars.
Q9How do you get the wind from the geostrophic wind scale?
AnswerMeasure the isobar spacing with dividers, lay it on the scale at your latitude, read the geostrophic wind. The surface wind is weaker than that, turned in towards the Low.
Common trapDo not use the geostrophic figure as your deck wind.
📚 Resources
Videos
- How to read a synoptic weather chart - Met Office explains — Met Office - UK Weather
Books
- NP100 The Mariner’s Handbook — UK Hydrographic Office (ADMIRALTY), 13th edition (2023): meteorology chapter, depressions and fronts
- Meteorology for Mariners — Met Office (HMSO), 3rd edition: frontal depressions and synoptic charts
Official sites
- Weather fronts — Met Office: warm, cold, occluded and waving fronts, with chart symbols
- High and low pressure — Met Office: how depressions form and the weather they bring
- Surface Pressure Charts — Met Office: live analysis and forecast charts for the North East Atlantic and Europe
- Admiralty Mariner’s Handbook (NP100) — UK Hydrographic Office
Exam focus — MCA
Typical questions • “Describe this synoptic chart.” → time (UTC) and type, isobars, Highs and Lows with central pressure, fronts, geostrophic scale; then what it means for your ship. • “How does a temperate depression form, and how is it different from a hurricane?” → turbulence between two opposing airflows of different temperature; it has fronts, it is larger and faster than a hurricane. • “A depression passes north of you. Talk me through the weather.” → ahead of the warm front: glass falls, wind backs, altostratus, rain; warm sector: wind veers, low cloud, drizzle, poor visibility; cold front: sharp veer, squalls, glass rises, temperature drops, then clear and showery. • “Draw and name the fronts.” → warm red semicircles, cold blue triangles, occluded purple both. • “How do you find the wind from the chart?” → dividers on the isobar spacing, geostrophic scale at your latitude, the surface wind is weaker, turned in towards the Low. What examiners look for: the stages in the right order, the correct words (back, veer, occluded, geostrophic), and a practical link to the bridge: when to warn the Master, prepare for squalls and expect poor visibility.